Lesson: Modules in Epinomy
Within Epinomy, the term 'Module' refers to the distinct categories or sectors that help organize the software’s extensive functionalities. Think of them as chapters in a book, where each chapter covers a specific subject. Each module encapsulates related tasks and functions, making it simpler to navigate and manage different operations, from buying and selling to stock management and beyond.
1. Overview of Modules
Modules are the building blocks of Epinomy, ensuring that tasks related to a particular area of operation are grouped together. For example, all tasks, reports, and functionalities related to the sales process are grouped under the 'Selling' module.
2. Accessing Modules
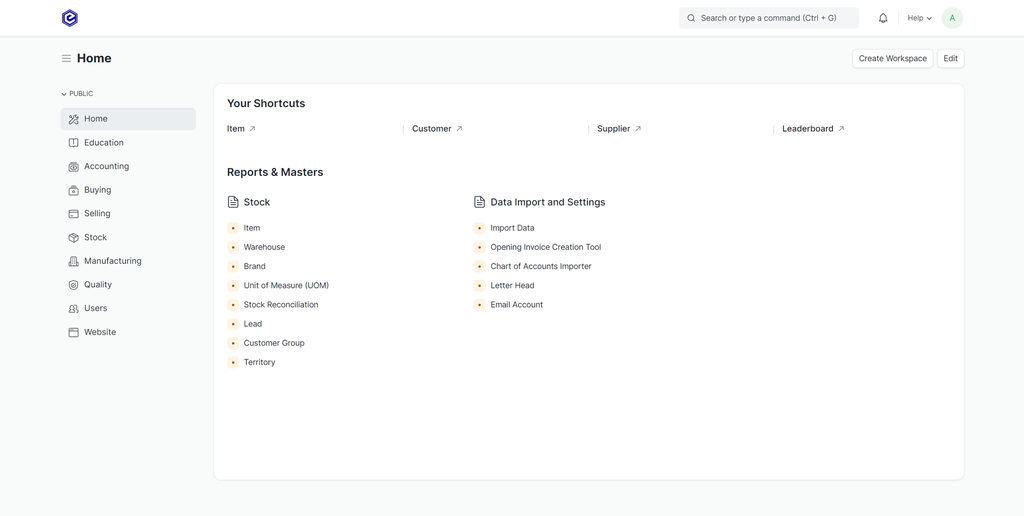
Each module in Epinomy is represented as a card or icon in the Workspace. By clicking on one of these icons, you gain access to the specific tools, reports, and functionalities of that module.
3. Anatomy of a Module
When you open a module, you'll generally find: - Dashboard: Provides a summary of the most important and frequently used data associated with the module. - Tools: Specific functionalities or applications related to that module. - Reports: Data summaries, often available in tabular or chart format, that provide insights on activities or trends related to that module. - Shortcuts: Quick links to frequently performed tasks or operations. - Settings: Options to customize or tweak how the module behaves or displays information.
4. Commonly Used Modules in Epinomy
- Selling: Manages all sales-related tasks like quotations, sales orders, and customer data.
- Buying: For purchase operations such as purchase orders, supplier quotations, and supplier data.
- Stock: Deals with inventory, warehouses, stock entries, and movement.
- Accounting: Handles financial aspects, including invoicing, billing, and ledgers.
- Manufacturing: For production processes, like production orders and bill of materials.
- Website: Tools and settings to manage your public-facing website, if Epinomy powers it.
- Education: Dedicated tools and settings for academic functionalities.
Exercise: Navigating and Exploring Modules
Objective: Get familiar with accessing and navigating through various modules in Epinomy.
Steps:
Accessing a Module: - From the Workspace, identify the 'Selling' module card/icon. - Click on it to access the module.

Exploring the Dashboard: - Once inside, take note of the dashboard's layout. Identify any visible charts, metrics, or summaries related to sales.
Using Tools: - Within the Selling module, look for a section or tab labeled 'Selling'. - Click on a DocType (e.g., 'Quotation') and explore the interface. Try creating a sample quotation.
Viewing Reports: - Navigate back the Selling module by selecting either the top left logo or the 'Selling' link next to it. - Open a report: Select the 'Sales Analytics' quick access link located above the 'Reports & Masters'. As data is created, all selling-related analytics can be displayed here with customizable filters and date ranges. The image below is an example of a customized Sales Analytics page.

Shortcuts and Settings: - Back on the Selling module page, identify any shortcuts present, and click on one to see where it leads. - Explore the 'Settings' of the Selling module, but avoid making any changes. It's important to familiarize yourself with available options.
Returning to Workspace: - Once you've finished exploring, navigate back to the main Workspace. This can usually be done by clicking on the Epinomy logo or the 'Home' option in the sidebar.
Exploring Another Module: - Repeat the steps above, but this time choose a different module, such as 'Buying' or 'Stock'. This repetition will reinforce your understanding and navigation skills.
Modules are the heart of Epinomy, ensuring that each operational aspect has its dedicated space, tools, and functionalities. By understanding how to access and navigate these modules, users can harness the power of Epinomy effectively, streamlining operations and gaining insights into various business areas. As we delve deeper into individual modules in subsequent lessons, this foundational understanding will be crucial.